Documentation Index
Fetch the complete documentation index at: https://forge-64364c0e.mintlify.app/llms.txt
Use this file to discover all available pages before exploring further.
Dashboard (00)
The Dashboard is the first screen when ForgeAI launches. It shows current system status, loaded model info, and provides quick access to every module with real-time activity tracking.
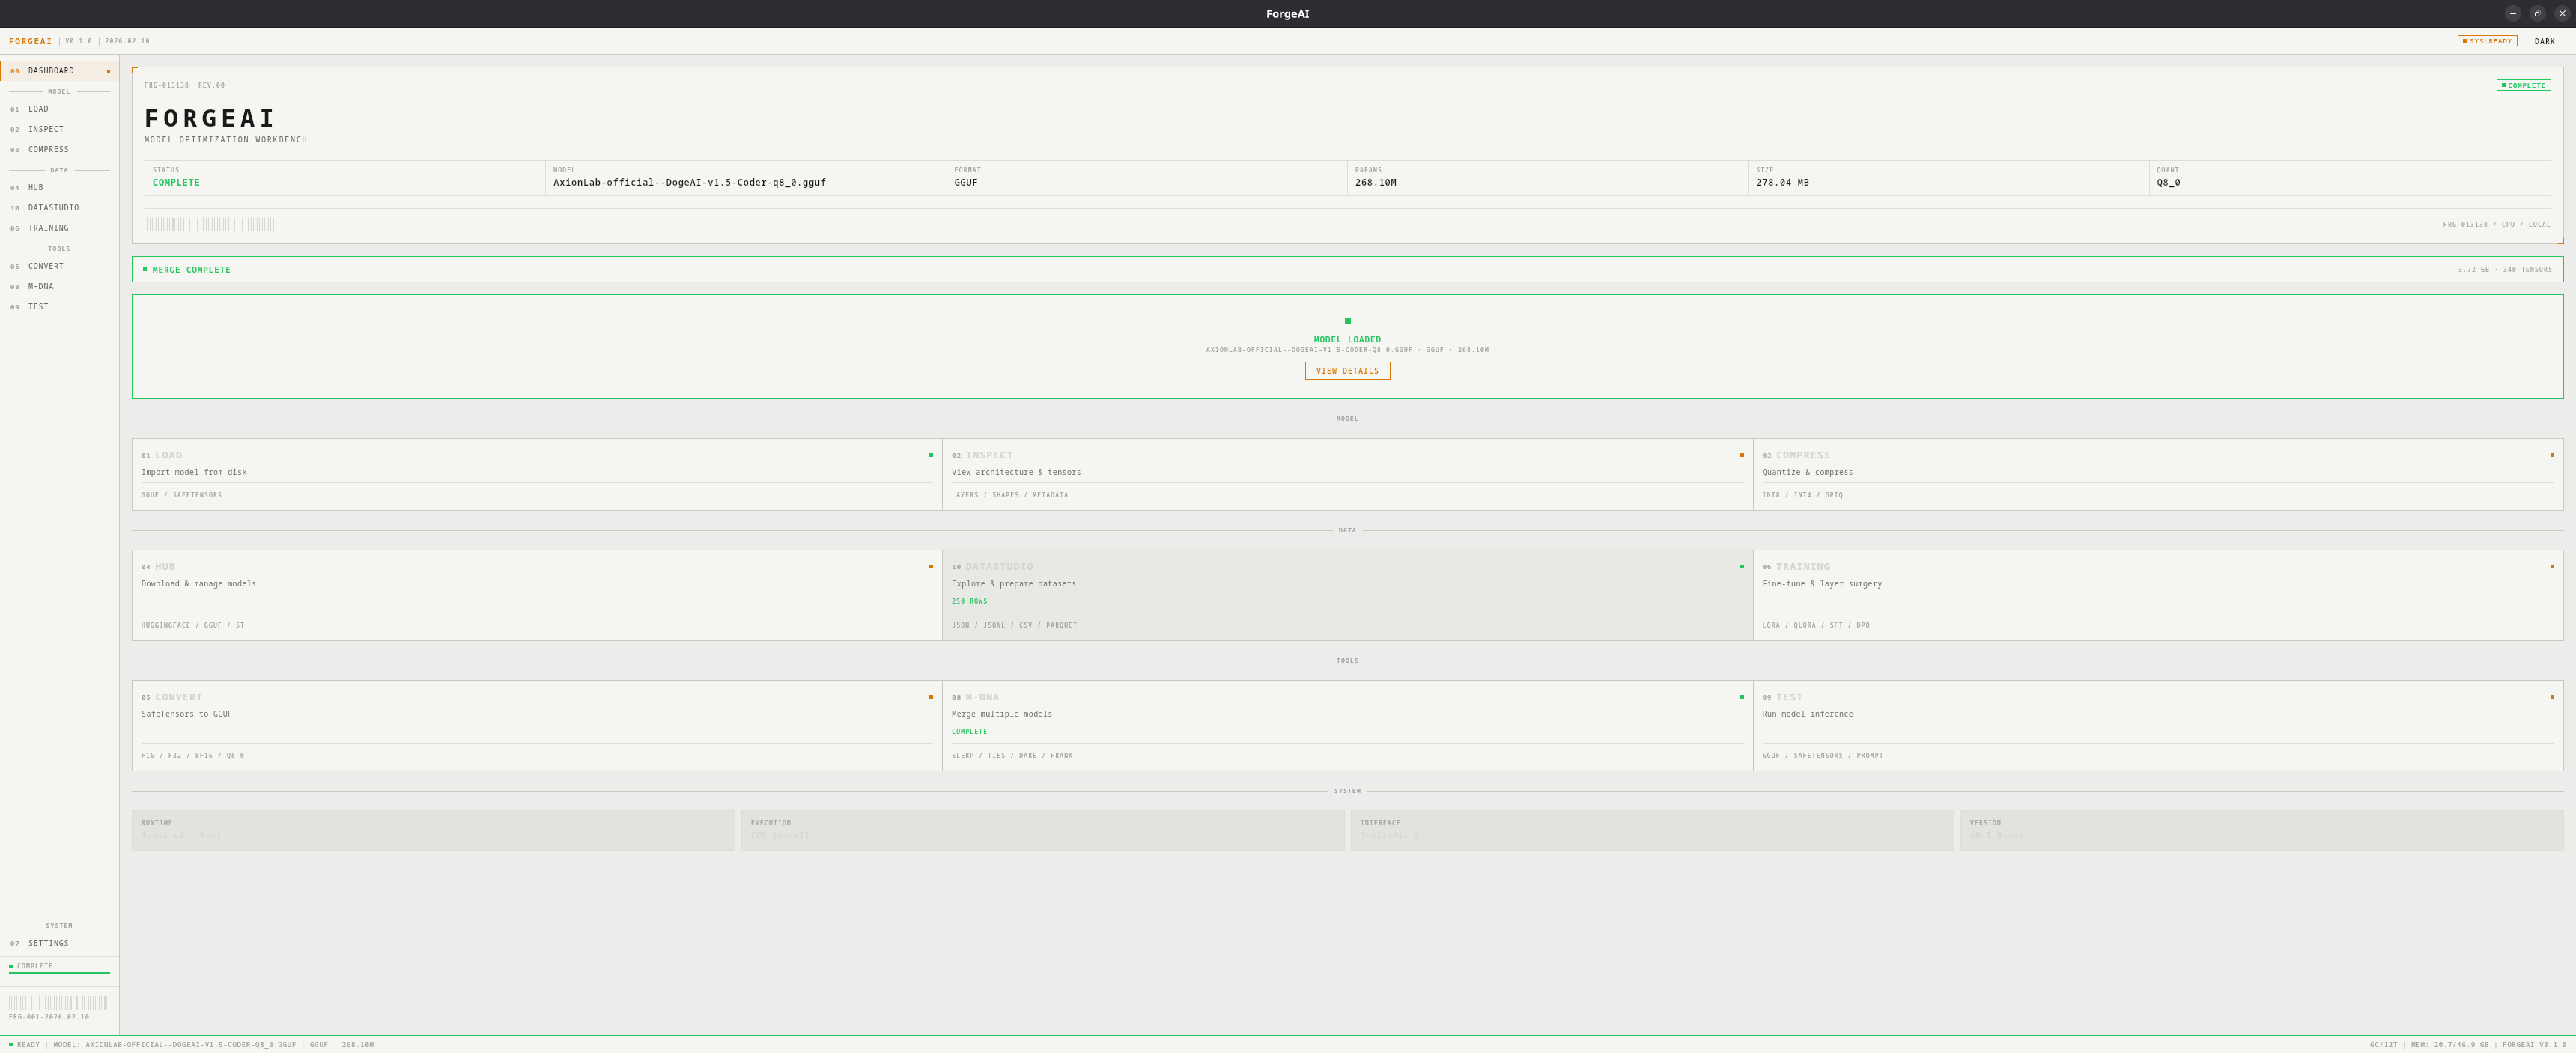
System Status Banner
Displays the ForgeAI brand and a live specs grid:
| Field | Description |
|---|
| STATUS | Current state — IDLE, LOADED, TRAINING, MERGING, ANALYZING, COMPLETE, ERROR |
| MODEL | Name of loaded model or ”---“ |
| FORMAT | GGUF or SAFETENSORS |
| PARAMS | Parameter count (e.g., 7.24B) |
| SIZE | File size on disk |
| QUANT | Quantization type (e.g., Q4_K_M) |
Module Groups
Modules are organized into three groups matching the sidebar:
| Group | Modules |
|---|
| MODEL | Load (01), Inspect (02), Compress (03) |
| DATA | Hub (04), DataStudio (10), Training (06) |
| TOOLS | Convert (05), M-DNA (08), Test (09) |
- Module code and name
- Short description
- Supported formats/operations
- Current status badge (ready / awaiting / active)
Live Activity Badges
When background tasks are running, module cards show real-time activity:
| Activity | Badge Example |
|---|
| Training in progress | TRAINING 45% (blue, pulsing) |
| Layer surgery | SURGERY (blue, pulsing) |
| Model merging | MERGING 72% (blue, pulsing) |
| Layer analysis | ANALYZING (blue, pulsing) |
| Merge complete | COMPLETE (green) |
| Dataset loaded | 52,002 ROWS (green) |
| Model loading | LOADING (blue, pulsing) |
Status Bar
Persistent across all screens at the bottom of the app:
- Left: current state indicator, loaded model name, format, parameters
- Right: CPU cores/threads, memory usage, version info
- Status bar border color changes: blue during active tasks, green on success, red on error
When a long-running task is active (training, merging, analyzing), the sidebar shows a progress indicator with percentage and pulsing animation.